This tutorial was written in collaboration with Johannes Faigle
In this tutorial, I show how to
- Set up Docker Compose to run CrateDB, Prometheus, and the CrateDB Prometheus Adapter
- Run the applications with Docker Compose
Note: this blog post uses CrateDB 4.7.0, Prometheus 2.33.3 and CrateDB Prometheus Adapter 0.4.0
Motivation
Prometheus is a monitoring software for collecting metrics data from applications and infrastructures. Its focus lies on collecting big amounts of concise event data from the monitored system, roughly timestamp points with key-value pairs.
Such data is very useful to track the state and trajectory of a system, so storing this data for the long term is a common need for Prometheus users.
This is where CrateDB comes into place. With the CrateDB Prometheus Adapter, one can easily store the collected metrics data in CrateDB and take advantage of its high ingestion and query speed and friendly UI to massively scale-out Prometheus.
Setting up Docker Compose
Both CrateDB, Prometheus, and the CrateDB Prometheus Adapter applications can be run as Docker containers. To then centralize the container management I use Docker Compose, this way I can build and run all the containers with a single command and set up the connections between them in a YAML file.
Before anything else, I follow the Docker Installation Tutorial to get Docker in my local machine.
Then, I create a directory in my local machine to host the necessary configuration files.
I’ll have a total of three of them, all following the YAML format. They can be easily created using any text editor, like TextEdit on a Mac, and then saved with the .yml format.
Creating docker-compose.yml
The first YAML file I create is docker-compose.yml, which wraps up the configurations for the three containers.
I specify CrateDB, Prometheus, and Adapter as services. Then, I add config.yml and prometheus.yml files as volumes to the Adapter and Prometheus containers, respectively. These files will be created in the following steps.
services:
  cratedb:
    image: "crate"
    ports:
      - "4200:4200"
      - "5432:5432"
  prometheus:
    image: "prom/prometheus"
    volumes:
      - ./prometheus.yml:/etc/prometheus/prometheus.yml
    ports:
      - "9090:9090"
  cratedb-prometheus-adapter:
    image: "ghcr.io/crate/cratedb-prometheus-adapter"
    volumes:
      - ./config.yml:/etc/cratedb-prometheus-adapter/config.yml
    ports:
      - "9268:9268"
Creating prometheus.yml
Next, following the Prometheus Documentation, I create a prometheus.yml file, which holds the scraping configuration for whichever service Prometheus collects metrics from.
To keep it simple, I follow the example in the Prometheus documentation and set it to monitor itself.
One last bit of configuration necessary to forward requests from Prometheus to the CrateDB Adapter is to set remote_write and remote_read to the Adapter URL, as stated in CrateDB Prometheus Adapter Setup.
As I’m running the Adapter on Docker instead of locally, the host in its URL will not be localhost, but rather however I called the Adapter service previously in my docker-compose.yml file, in this case, cratedb-prometheus-adapter.
The resulting prometheus.yml looks then like this:
global:
  scrape_interval:     15s # By default, scrape targets every 15 seconds.

  # Attach these labels to any time series or alerts when communicating with
  # external systems (federation, remote storage, Alertmanager).
  external_labels:
    monitor: 'codelab-monitor'

# A scrape configuration containing exactly one endpoint to scrape:
# Here it's Prometheus itself.
scrape_configs:
  # The job name is added as a label `job=<job_name>` to any time-series scraped from this config.
  - job_name: 'prometheus'

    # Override the global default and scrape targets from this job every 5 seconds.
    scrape_interval: 5s

    static_configs:
      - targets: ['localhost:9090']

remote_write:
  - url: http://cratedb-prometheus-adapter:9268/write
remote_read:
  - url: http://cratedb-prometheus-adapter:9268/read
Creating config.yml
Finally, following the CrateDB Prometheus Adapter setup instructions, I create the config.yml file, which defines the CrateDB endpoints the Adapter writes to.
As I did previously in the prometheus.yml file, the host is set to cratedb, which is how I declared the CrateDB service on the docker-compose.yml file, instead of the default localhost. The remaining variables are set with their default values.
cratedb_endpoints:
- host: "cratedb"           # Host to connect to (default: "localhost")
  port: 5432                # Port to connect to (default: 5432).
  user: "crate"             # Username to use (default: "crate")
  password: ""              # Password to use (default: "").
  schema: ""                # Schema to use (default: "").
  connect_timeout: 10       # TCP connect timeout (seconds) (default: 10).
  max_connections: 5        # The maximum number of concurrent connections (default: 5).
  enable_tls: false         # Whether to connect using TLS (default: false).
  allow_insecure_tls: false # Whether to allow insecure / invalid TLS certificates (default: false).
I make sure both docker-compose.yml, config.yml, and prometheus.yml are in the same directory in my local machine.
Running the services
Finally, I navigate to my CrateDB-Prometheus directory in my terminal and start Docker Compose with the docker-compose up command
$ cd /Users/Path/To/Directory/CrateDB-Prometheus
$ docker-compose up
With Docker Compose up and running, I follow the CrateDB Prometheus Adapter setup instructions, navigate to the CrateDB Admin UI at http://localhost:4200 and create a metrics table in CrateDB, which will store the metrics gathered by Prometheus.
CREATE TABLE "metrics" (
    "timestamp" TIMESTAMP,
    "labels_hash" STRING,
    "labels" OBJECT(DYNAMIC),
    "value" DOUBLE,
    "valueRaw" LONG,
    "day__generated" TIMESTAMP GENERATED ALWAYS AS date_trunc('day', "timestamp"),
    PRIMARY KEY ("timestamp", "labels_hash", "day__generated")
  ) PARTITIONED BY ("day__generated")
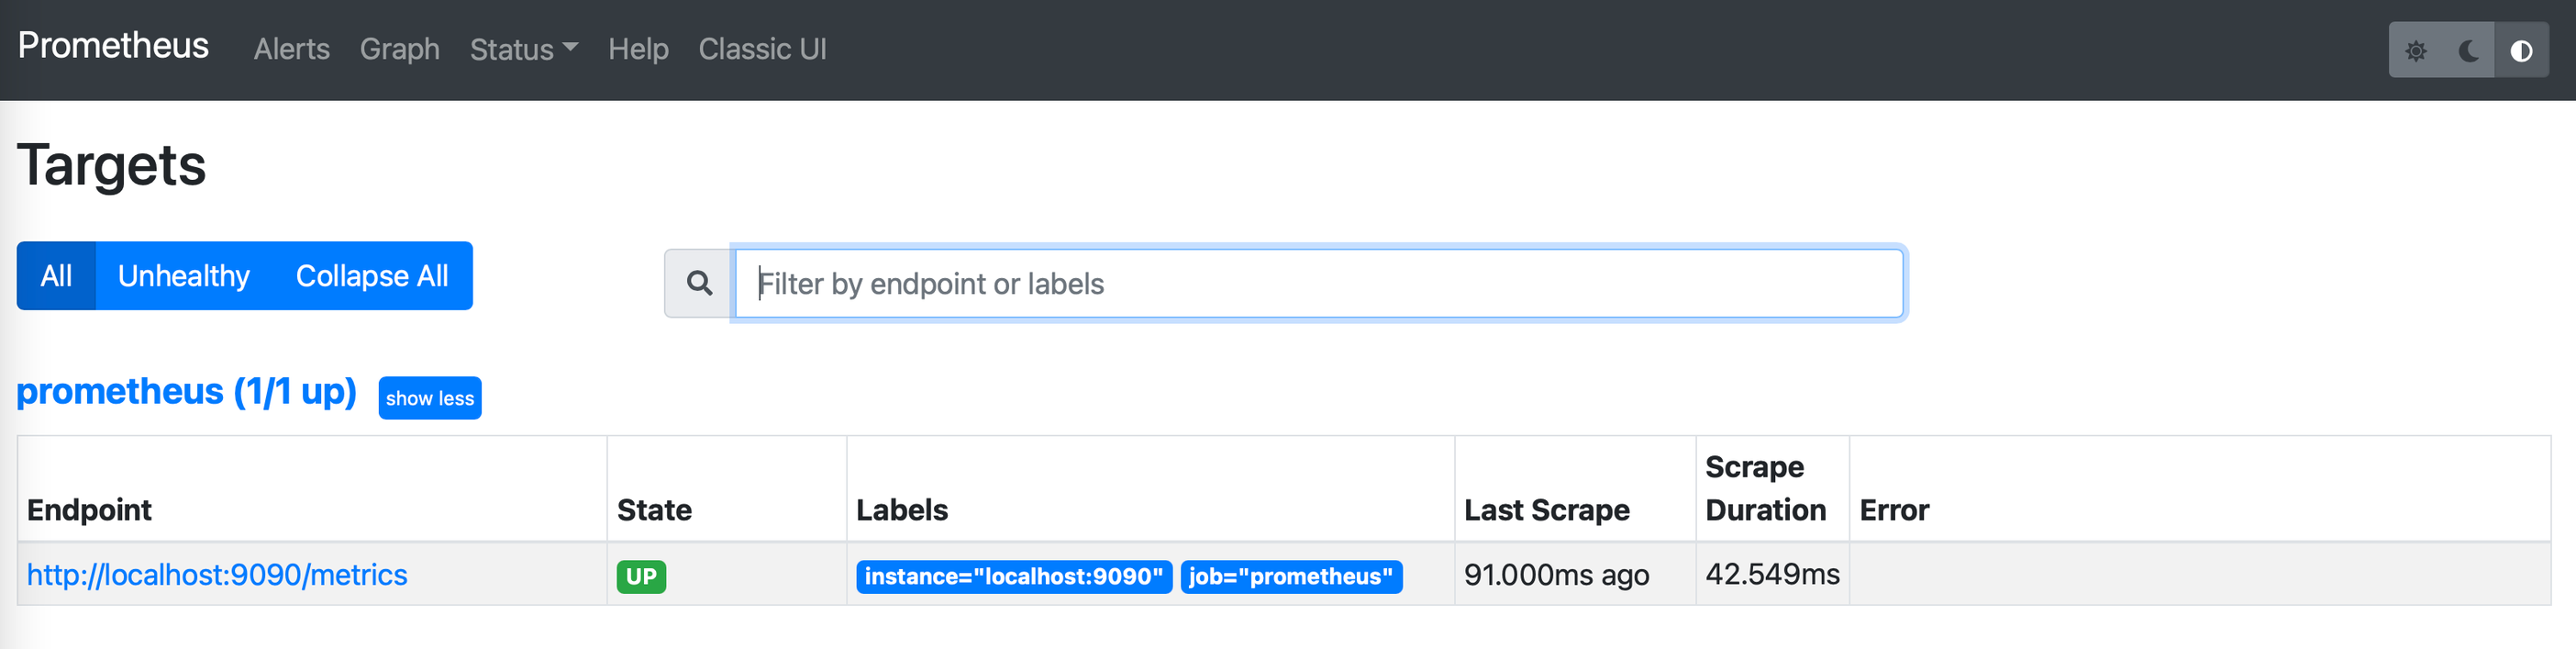
Then I navigate to http://localhost:9090, where I find the Prometheus UI. There, I head to Status and then Targets

And confirm that Prometheus is successfully monitoring itself.
Lastly, I head back to the CrateDB Admin UI and select the metrics table I just created.
I see that only after a few minutes of running, Prometheus has gathered over 300k data points.

I can now enjoy CrateDB’s incredible query speed to analyze and visualize this data using tools like Grafana, which works effortlessly with CrateDB.
Here are a few interesting tutorials on that matter: